White-browed Scrubwren
Sericornis frontalis
ABR description
The following is extracted from the Annual Bird Report for the twelve months to June 2017.
Very common, breeding resident
Found in most areas where there is suitable cover.
General: The table shows how records have increased, and the number of birds sighted has increased to 4535, the highest ever. From 116 grid cells (37%), from 52 weeks. Reporting rate 10.9% similar to last year (11.8%), the 10YA (12.5) and the 30YA (14.3%). Abundance (0.3204) similar to last year, the 10YA and the 30YA. Max 26/8 Apr ANBG (MaL2), mean 3.0 and median 2. Breeding in 14 grid cells, from nb/23 Aug JWNR (HeS1) to dy/2 Mar Corin Dam (HeS1).
GBS: 400 records (473 last year) from 33 sites (56%) from all weeks. Higher number of records in summer (30%) and autumn (33%). Abundance like last year and the 10YA but up 46% on the 30YA, continuing a general upward trend starting in about 2000. Average 1.9 and median 1. 8 breeding records (9 last year) from 4 suburban sites, commencing with dy/2wk Aug Page (AlB1) and concluding with dy/4wk Feb Chapman (HaJ1).
Abundance
Abundance is the average number of birds of that species per survey. Where the species was observed (presence recorded) but the number of birds seen was not recorded, this is treated as a count of zero.
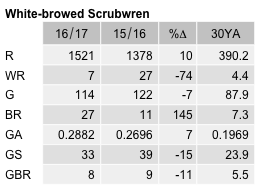
Abundance by year
This chart shows the abundance of White-browed Scrubwren between 1982 and 2017. 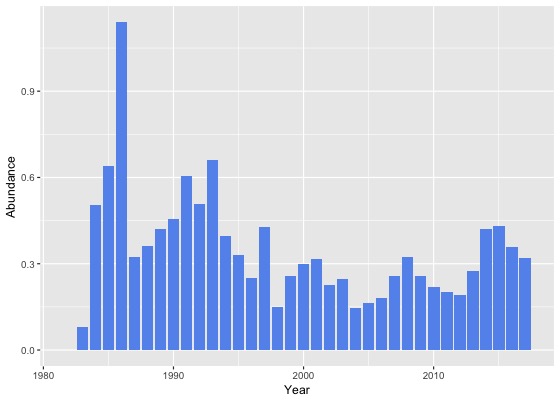
Abundance by month
This chart shows the monthly abundance of White-browed Scrubwren. The blue lines show the abundance for the twelve months to June 2017 and the bars show the average abundance for the period 1982 to 2017. 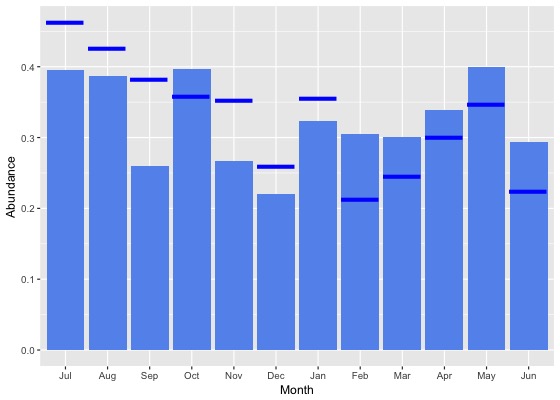
Abundance by season
This chart shows the seasonal abundance of White-browed Scrubwren. The blue lines show the seasonal abundance for the twelve months to June 2017 and the bars show the average seasonal abundance for the period 1982 to 2017. 
Abundance data
| Month | Season | ||||||||||||||||||
|---|---|---|---|---|---|---|---|---|---|---|---|---|---|---|---|---|---|---|---|
| Period | Jul | Aug | Sep | Oct | Nov | Dec | Jan | Feb | Mar | Apr | May | Jun | Winter | Spring | Summer | Autumn | All | ||
| All years | |||||||||||||||||||
| All | 0.4 | 0.4 | 0.3 | 0.4 | 0.3 | 0.2 | 0.3 | 0.3 | 0.3 | 0.3 | 0.4 | 0.3 | 0.4 | 0.3 | 0.3 | 0.3 | 0.3 | ||
| Previous years | |||||||||||||||||||
| All previous years | 0.4 | 0.4 | 0.2 | 0.4 | 0.3 | 0.2 | 0.3 | 0.3 | 0.3 | 0.3 | 0.4 | 0.3 | 0.4 | 0.3 | 0.3 | 0.3 | 0.3 | ||
| Previous 30 years | 0.4 | 0.4 | 0.2 | 0.4 | 0.2 | 0.2 | 0.3 | 0.3 | 0.3 | 0.3 | 0.4 | 0.3 | 0.3 | 0.3 | 0.3 | 0.3 | 0.3 | ||
| Previous 20 years | 0.4 | 0.4 | 0.2 | 0.4 | 0.2 | 0.2 | 0.3 | 0.3 | 0.3 | 0.3 | 0.4 | 0.3 | 0.3 | 0.3 | 0.3 | 0.3 | 0.3 | ||
| 10 year groups | |||||||||||||||||||
| [2007,2017) | 0.4 | 0.4 | 0.3 | 0.4 | 0.2 | 0.2 | 0.3 | 0.3 | 0.3 | 0.3 | 0.4 | 0.3 | 0.4 | 0.3 | 0.3 | 0.3 | 0.3 | ||
| [1997,2007) | 0.4 | 0.3 | 0.1 | 0.3 | 0.2 | 0.1 | 0.3 | 0.3 | 0.2 | 0.3 | 0.3 | 0.2 | 0.3 | 0.2 | 0.2 | 0.3 | 0.2 | ||
| [1987,1997) | 0.4 | 0.4 | 0.3 | 0.3 | 0.3 | 0.3 | 0.4 | 0.4 | 0.5 | 0.6 | 0.5 | 0.5 | 0.4 | 0.3 | 0.4 | 0.5 | 0.4 | ||
| 5 year groups | |||||||||||||||||||
| [2012,2017) | 0.4 | 0.5 | 0.3 | 0.4 | 0.3 | 0.3 | 0.3 | 0.3 | 0.3 | 0.4 | 0.4 | 0.4 | 0.4 | 0.4 | 0.3 | 0.4 | 0.4 | ||
| [2007,2012) | 0.3 | 0.2 | 0.1 | 0.4 | 0.2 | 0.1 | 0.3 | 0.3 | 0.2 | 0.2 | 0.3 | 0.2 | 0.2 | 0.3 | 0.2 | 0.2 | 0.2 | ||
| [2002,2007) | 0.3 | 0.2 | 0.1 | 0.3 | 0.2 | 0.1 | 0.2 | 0.2 | 0.2 | 0.2 | 0.2 | 0.2 | 0.2 | 0.2 | 0.2 | 0.2 | 0.2 | ||
| [1997,2002) | 0.5 | 0.4 | 0.2 | 0.3 | 0.2 | 0.2 | 0.3 | 0.4 | 0.4 | 0.3 | 0.5 | 0.2 | 0.3 | 0.2 | 0.3 | 0.4 | 0.3 | ||
| [1992,1997) | 0.5 | 0.4 | 0.2 | 0.3 | 0.2 | 0.2 | 0.5 | 0.3 | 0.7 | 0.6 | 0.6 | 0.3 | 0.4 | 0.3 | 0.4 | 0.6 | 0.4 | ||
| [1987,1992) | 0.4 | 0.4 | 0.4 | 0.3 | 0.3 | 0.4 | 0.4 | 0.4 | 0.4 | 0.5 | 0.5 | 0.6 | 0.4 | 0.3 | 0.4 | 0.5 | 0.4 | ||
| Year | |||||||||||||||||||
| 2017 | 0.5 | 0.4 | 0.4 | 0.4 | 0.4 | 0.3 | 0.4 | 0.2 | 0.2 | 0.3 | 0.3 | 0.2 | 0.3 | 0.4 | 0.3 | 0.3 | 0.3 | ||
| 2016 | 0.4 | 0.5 | 0.4 | 0.4 | 0.4 | 0.3 | 0.3 | 0.3 | 0.2 | 0.4 | 0.4 | 0.3 | 0.4 | 0.4 | 0.3 | 0.3 | 0.4 | ||
| 2015 | 0.5 | 0.8 | 0.5 | 0.5 | 0.2 | 0.4 | 0.3 | 0.4 | 0.4 | 0.4 | 0.4 | 0.4 | 0.5 | 0.4 | 0.3 | 0.4 | 0.4 | ||
| 2014 | 0.4 | 0.3 | 0.2 | 0.6 | 0.2 | 0.3 | 0.4 | 0.2 | 0.6 | 0.5 | 0.8 | 0.5 | 0.4 | 0.4 | 0.3 | 0.6 | 0.4 | ||
| 2013 | 0.5 | 0.3 | 0.2 | 0.4 | 0.2 | 0.1 | 0.3 | 0.2 | 0.2 | 0.2 | 0.6 | 0.3 | 0.4 | 0.3 | 0.2 | 0.3 | 0.3 | ||
| 2012 | 0.1 | 0.2 | 0.1 | 0.4 | 0.1 | 0.1 | 0.1 | 0.1 | 0.1 | 0.2 | 0.1 | 0.4 | 0.2 | 0.2 | 0.1 | 0.1 | 0.2 | ||
| 2011 | 0.4 | 0.1 | 0.2 | 0.5 | 0.2 | 0.0 | 0.3 | 0.2 | 0.1 | 0.2 | 0.1 | 0.1 | 0.2 | 0.3 | 0.2 | 0.1 | 0.2 | ||
| 2010 | 0.3 | 0.2 | 0.1 | 0.4 | 0.2 | 0.1 | 0.2 | 0.2 | 0.1 | 0.2 | 0.3 | 0.1 | 0.2 | 0.3 | 0.2 | 0.2 | 0.2 | ||
| 2009 | 0.2 | 0.4 | 0.1 | 0.4 | 0.3 | 0.0 | 0.3 | 0.3 | 0.3 | 0.2 | 0.2 | 0.2 | 0.2 | 0.3 | 0.2 | 0.2 | 0.3 | ||
| 2008 | 0.2 | 0.3 | 0.1 | 0.5 | 0.2 | 0.2 | 0.6 | 0.5 | 0.2 | 0.3 | 0.7 | 0.2 | 0.2 | 0.3 | 0.4 | 0.3 | 0.3 | ||
| 2007 | 0.3 | 0.1 | 0.1 | 0.4 | 0.1 | 0.1 | 0.4 | 0.5 | 0.2 | 0.2 | 0.4 | 0.3 | 0.2 | 0.2 | 0.3 | 0.3 | 0.3 | ||
| 2006 | 0.1 | 0.1 | 0.0 | 0.4 | 0.1 | 0.0 | 0.2 | 0.2 | 0.1 | 0.2 | 0.1 | 0.2 | 0.1 | 0.3 | 0.1 | 0.2 | 0.2 | ||
| 2005 | 0.3 | 0.1 | 0.1 | 0.2 | 0.2 | 0.0 | 0.3 | 0.2 | 0.1 | 0.1 | 0.2 | 0.3 | 0.3 | 0.1 | 0.1 | 0.1 | 0.2 | ||
| 2004 | 0.4 | 0.1 | 0.1 | 0.2 | 0.1 | 0.1 | 0.2 | 0.2 | 0.1 | 0.1 | 0.2 | 0.0 | 0.2 | 0.1 | 0.1 | 0.1 | 0.1 | ||
| 2003 | 0.7 | 0.3 | 0.2 | 0.2 | 0.1 | 0.1 | 0.1 | 0.4 | 0.3 | 0.3 | 0.5 | 0.1 | 0.3 | 0.1 | 0.2 | 0.3 | 0.2 | ||
| 2002 | 0.2 | 0.3 | 0.1 | 0.3 | 0.4 | 0.1 | 0.2 | 0.2 | 0.2 | 0.3 | 0.2 | 0.1 | 0.2 | 0.3 | 0.2 | 0.3 | 0.2 | ||
| 2001 | 0.4 | 0.4 | 0.2 | 0.4 | 0.2 | 0.2 | 0.4 | 0.5 | 0.2 | 0.4 | 0.5 | 0.1 | 0.3 | 0.3 | 0.4 | 0.3 | 0.3 | ||
| 2000 | 0.3 | 0.3 | 0.1 | 0.2 | 0.4 | 0.3 | 0.3 | 0.3 | 0.4 | 0.3 | 0.3 | 0.2 | 0.3 | 0.3 | 0.3 | 0.3 | 0.3 | ||
| 1999 | 0.6 | 0.4 | 0.1 | 0.3 | 0.3 | 0.1 | 0.4 | 0.5 | 0.3 | 0.2 | 0.3 | 0.1 | 0.2 | 0.2 | 0.3 | 0.3 | 0.3 | ||
| 1998 | 0.0 | 0.3 | 0.2 | 0.3 | 0.0 | 0.0 | 0.1 | 0.3 | 0.0 | 0.2 | 0.6 | 0.1 | 0.2 | 0.2 | 0.1 | 0.2 | 0.2 | ||
| 1997 | 1.0 | 0.5 | 0.1 | 0.2 | 0.1 | 0.1 | 0.3 | 0.2 | 2.1 | 0.5 | 1.3 | 0.2 | 0.6 | 0.1 | 0.1 | 1.0 | 0.4 | ||
| 1996 | 0.3 | 0.2 | 0.1 | 0.1 | 0.2 | 0.1 | 0.7 | 0.2 | 0.1 | 0.3 | 0.5 | 0.2 | 0.2 | 0.1 | 0.4 | 0.3 | 0.2 | ||
| 1995 | 0.4 | 0.5 | 0.3 | 0.1 | 0.3 | 0.5 | 0.2 | 0.1 | 0.5 | 0.3 | 0.2 | 0.6 | 0.5 | 0.2 | 0.3 | 0.3 | 0.3 | ||
| 1994 | 0.8 | 0.3 | 0.2 | 0.7 | 0.1 | 0.1 | 0.5 | 0.6 | 0.2 | 0.5 | 0.9 | 0.2 | 0.4 | 0.3 | 0.4 | 0.5 | 0.4 | ||
| 1993 | 0.5 | 0.4 | 0.2 | 0.3 | 0.2 | 0.2 | 1.2 | 0.3 | 2.2 | 1.2 | 0.5 | 0.2 | 0.4 | 0.2 | 0.6 | 1.3 | 0.7 | ||
| 1992 | 0.4 | 0.4 | 0.3 | 0.6 | 0.6 | 0.3 | 0.2 | 0.3 | 1.0 | 1.3 | 0.6 | 0.1 | 0.3 | 0.5 | 0.2 | 0.9 | 0.5 | ||
| 1991 | 0.2 | 0.6 | 0.8 | 0.4 | 0.6 | 0.3 | 0.8 | 0.7 | 0.4 | 0.6 | 0.6 | 2.2 | 0.7 | 0.6 | 0.6 | 0.5 | 0.6 | ||
| 1990 | 0.4 | 0.3 | 0.3 | 0.2 | 0.2 | 0.3 | 0.2 | 0.2 | 0.5 | 1.3 | 1.1 | 1.0 | 0.5 | 0.2 | 0.3 | 0.9 | 0.5 | ||
| 1989 | 0.5 | 0.3 | 0.4 | 0.4 | 0.3 | 0.5 | 0.4 | 0.4 | 0.3 | 0.5 | 0.4 | 0.5 | 0.4 | 0.4 | 0.4 | 0.4 | 0.4 | ||
| 1988 | 0.3 | 0.4 | 0.2 | 0.4 | 0.3 | 0.4 | 0.4 | 0.4 | 0.4 | 0.4 | 0.5 | 0.3 | 0.4 | 0.3 | 0.4 | 0.4 | 0.4 | ||
| 1987 | 0.4 | 0.1 | 0.3 | 0.3 | 0.3 | 0.3 | 0.3 | 0.3 | 0.3 | 0.4 | 0.3 | 0.4 | 0.4 | 0.3 | 0.3 | 0.3 | 0.3 | ||
| 1986 | 0.7 | 0.7 | 0.8 | 1.5 | 1.2 | 1.5 | 1.4 | 1.0 | 0.7 | 1.5 | 1.2 | 1.4 | 0.9 | 1.1 | 1.3 | 1.2 | 1.1 | ||
| 1985 | 0.6 | 0.7 | 0.7 | 0.9 | 0.6 | 0.6 | 0.1 | 0.6 | 0.1 | 0.7 | 0.1 | 0.5 | 0.6 | 0.7 | 0.6 | 0.4 | 0.6 | ||
| 1984 | 0.0 | 0.0 | 0.0 | 0.0 | 0.0 | 0.0 | 0.5 | 0.9 | 1.0 | 0.4 | 0.7 | 0.4 | 0.3 | 0.0 | 0.6 | 0.7 | 0.5 | ||
| 1983 | 0.0 | 0.0 | 0.0 | 0.2 | 0.4 | 0.2 | 0.0 | 0.0 | 0.0 | - | 0.0 | 0.0 | 0.0 | 0.2 | 0.1 | 0.0 | 0.1 | ||
| 1982 | - | 0.0 | - | 0.0 | 0.0 | 0.0 | - | 0.0 | - | 0.0 | - | 0.0 | 0.0 | 0.0 | 0.0 | 0.0 | 0.0 | ||
Reporting rates
Reporting rate is the proportion of all surveys in which the species was present.
Reporting rate by year
This chart shows the reporting rate of White-browed Scrubwren each year between 1982 and 2017. 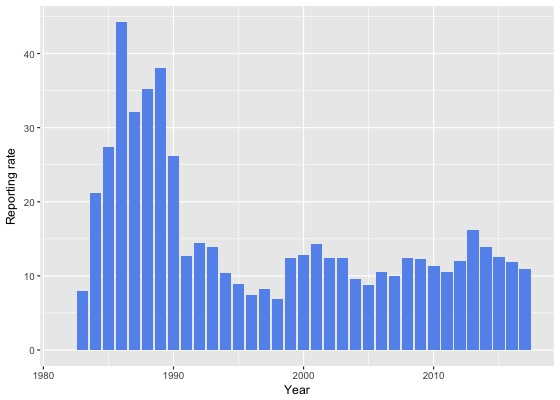
Reporting rate by month
This chart shows the reporting rate by month of White-browed Scrubwren. The blue lines show the reporting rate for the twelve months to June 2017 and the bars show the average reporting rate for the period 1982 to 2017. 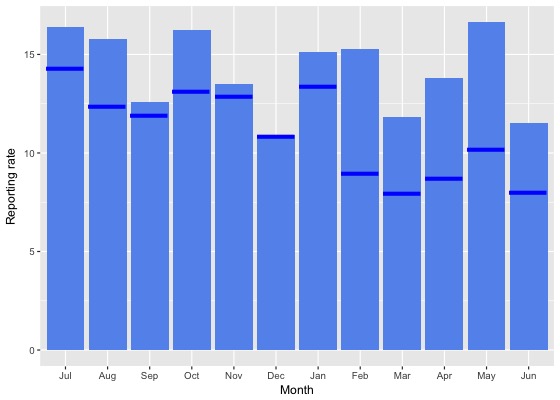
Reporting rate by season
This chart shows the seasonal reporting rate of White-browed Scrubwren. The blue lines show the seasonal reporting rate for the twelve months to June 2017 and the bars show the average seasonal reporting rate for the period 1982 to 2017. 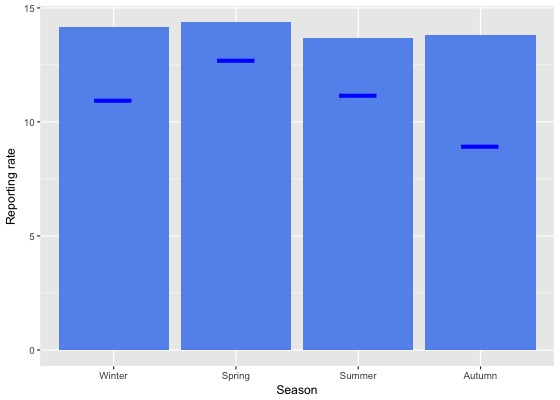
Reporting rate data
| Month | Season | ||||||||||||||||||
|---|---|---|---|---|---|---|---|---|---|---|---|---|---|---|---|---|---|---|---|
| Period | Jul | Aug | Sep | Oct | Nov | Dec | Jan | Feb | Mar | Apr | May | Jun | Winter | Spring | Summer | Autumn | All | ||
| All years | |||||||||||||||||||
| All | 16.4 | 15.8 | 12.6 | 16.2 | 13.5 | 10.9 | 15.1 | 15.3 | 11.8 | 13.8 | 16.6 | 11.5 | 14.2 | 14.4 | 13.7 | 13.8 | 14.0 | ||
| Previous years | |||||||||||||||||||
| All previous years | 16.7 | 16.4 | 12.7 | 16.6 | 13.6 | 10.9 | 15.4 | 16.6 | 12.5 | 14.6 | 18.1 | 12.2 | 14.8 | 14.6 | 14.2 | 14.7 | 14.5 | ||
| Previous 30 years | 16.5 | 16.2 | 12.4 | 16.5 | 13.1 | 10.7 | 15.3 | 16.5 | 12.3 | 14.3 | 17.9 | 12.1 | 14.6 | 14.3 | 14.0 | 14.5 | 14.3 | ||
| Previous 20 years | 13.3 | 13.8 | 10.3 | 15.3 | 10.2 | 8.5 | 13.6 | 14.7 | 10.3 | 11.8 | 15.1 | 9.7 | 11.9 | 12.5 | 12.1 | 12.0 | 12.1 | ||
| 10 year groups | |||||||||||||||||||
| [2007,2017) | 13.3 | 13.9 | 11.7 | 15.8 | 10.5 | 9.4 | 13.6 | 14.0 | 10.5 | 11.3 | 14.2 | 10.3 | 12.1 | 13.4 | 12.3 | 11.7 | 12.5 | ||
| [1997,2007) | 13.3 | 13.7 | 7.6 | 13.8 | 9.6 | 6.8 | 13.3 | 16.4 | 9.7 | 13.0 | 17.4 | 8.4 | 11.3 | 10.3 | 11.3 | 12.6 | 11.4 | ||
| [1987,1997) | 27.6 | 23.6 | 23.2 | 23.2 | 22.7 | 23.0 | 25.4 | 24.9 | 23.7 | 27.4 | 28.4 | 24.1 | 25.0 | 23.0 | 24.4 | 26.5 | 24.6 | ||
| 5 year groups | |||||||||||||||||||
| [2012,2017) | 13.8 | 14.8 | 13.0 | 15.7 | 10.6 | 11.0 | 13.2 | 13.5 | 11.1 | 12.2 | 14.1 | 11.8 | 13.3 | 13.6 | 12.6 | 12.3 | 12.9 | ||
| [2007,2012) | 12.0 | 10.6 | 8.5 | 15.9 | 10.5 | 5.9 | 15.3 | 16.2 | 8.9 | 9.4 | 14.4 | 7.6 | 9.3 | 12.9 | 11.4 | 10.3 | 11.3 | ||
| [2002,2007) | 12.6 | 12.1 | 7.2 | 15.4 | 9.7 | 6.2 | 12.2 | 16.1 | 8.9 | 12.3 | 15.1 | 7.1 | 10.2 | 10.9 | 10.4 | 11.5 | 10.8 | ||
| [1997,2002) | 14.3 | 15.6 | 8.1 | 11.4 | 9.5 | 7.6 | 14.6 | 16.8 | 10.7 | 14.0 | 20.2 | 10.1 | 12.9 | 9.6 | 12.4 | 14.1 | 12.1 | ||
| [1992,1997) | 12.3 | 10.0 | 8.7 | 10.1 | 8.9 | 6.2 | 12.8 | 10.8 | 12.3 | 14.6 | 12.8 | 7.0 | 9.6 | 9.3 | 10.0 | 13.2 | 10.5 | ||
| [1987,1992) | 34.5 | 31.0 | 30.0 | 30.4 | 29.3 | 30.3 | 32.4 | 30.3 | 30.5 | 34.8 | 36.5 | 33.8 | 33.0 | 29.9 | 31.0 | 33.9 | 31.8 | ||
| Year | |||||||||||||||||||
| 2017 | 14.3 | 12.4 | 11.9 | 13.2 | 12.9 | 10.8 | 13.4 | 9.0 | 8.0 | 8.7 | 10.2 | 8.0 | 11.0 | 12.7 | 11.2 | 8.9 | 10.9 | ||
| 2016 | 13.9 | 14.1 | 12.9 | 12.6 | 10.4 | 9.0 | 12.4 | 13.3 | 9.3 | 11.2 | 12.7 | 10.5 | 12.8 | 12.1 | 11.8 | 10.9 | 11.8 | ||
| 2015 | 12.4 | 18.1 | 17.8 | 15.3 | 9.2 | 13.2 | 9.9 | 11.5 | 11.4 | 9.8 | 11.5 | 12.1 | 13.8 | 14.4 | 11.4 | 10.9 | 12.6 | ||
| 2014 | 14.5 | 13.0 | 8.6 | 19.2 | 10.4 | 14.5 | 15.1 | 11.1 | 11.9 | 16.1 | 18.0 | 11.0 | 12.3 | 14.2 | 13.8 | 14.7 | 13.9 | ||
| 2013 | 17.7 | 13.6 | 13.5 | 18.7 | 13.8 | 10.7 | 20.3 | 22.6 | 15.2 | 16.5 | 22.2 | 10.5 | 13.6 | 15.9 | 17.0 | 17.1 | 16.2 | ||
| 2012 | 11.9 | 13.8 | 8.8 | 16.2 | 10.1 | 9.7 | 11.0 | 11.2 | 9.8 | 10.7 | 12.8 | 16.0 | 14.1 | 12.8 | 10.6 | 10.8 | 12.1 | ||
| 2011 | 9.8 | 6.4 | 9.7 | 14.1 | 9.7 | 6.2 | 16.9 | 13.7 | 6.6 | 10.7 | 12.0 | 7.0 | 7.4 | 12.1 | 12.1 | 9.6 | 10.6 | ||
| 2010 | 17.7 | 8.8 | 10.9 | 17.7 | 9.1 | 9.1 | 15.9 | 10.6 | 6.7 | 8.5 | 12.7 | 5.7 | 8.9 | 13.9 | 11.8 | 8.5 | 11.3 | ||
| 2009 | 12.9 | 17.7 | 8.3 | 17.3 | 12.9 | 3.7 | 14.7 | 20.8 | 13.5 | 8.6 | 12.2 | 5.9 | 10.5 | 14.0 | 11.8 | 11.2 | 12.3 | ||
| 2008 | 10.3 | 12.2 | 7.9 | 16.3 | 11.4 | 5.0 | 20.6 | 21.3 | 11.8 | 9.3 | 19.8 | 9.3 | 10.3 | 13.3 | 13.2 | 12.0 | 12.4 | ||
| 2007 | 9.9 | 9.3 | 5.8 | 13.8 | 8.8 | 4.7 | 10.2 | 15.7 | 8.1 | 9.4 | 18.7 | 9.8 | 9.7 | 10.6 | 8.7 | 10.8 | 10.0 | ||
| 2006 | 8.6 | 8.7 | 5.3 | 17.1 | 8.9 | 2.8 | 12.9 | 16.3 | 11.7 | 7.0 | 18.1 | 6.1 | 7.4 | 12.0 | 10.2 | 11.7 | 10.6 | ||
| 2005 | 9.6 | 8.4 | 6.7 | 12.2 | 10.3 | 5.2 | 13.5 | 17.4 | 6.1 | 7.1 | 13.9 | 5.0 | 6.9 | 9.2 | 9.9 | 8.9 | 8.8 | ||
| 2004 | 15.9 | 12.5 | 7.7 | 15.1 | 9.9 | 6.0 | 7.9 | 14.1 | 5.2 | 9.9 | 9.7 | 1.8 | 10.9 | 10.7 | 8.3 | 7.9 | 9.6 | ||
| 2003 | 19.7 | 15.1 | 10.2 | 10.4 | 6.9 | 6.4 | 14.8 | 18.1 | 8.5 | 18.4 | 15.5 | 13.7 | 15.8 | 9.1 | 12.3 | 13.9 | 12.4 | ||
| 2002 | 9.1 | 14.4 | 6.0 | 19.3 | 13.0 | 8.8 | 12.6 | 13.8 | 10.9 | 18.5 | 18.8 | 10.2 | 10.9 | 13.1 | 10.9 | 15.0 | 12.4 | ||
| 2001 | 18.2 | 17.5 | 8.9 | 16.8 | 10.2 | 12.0 | 17.0 | 21.6 | 9.3 | 17.1 | 22.0 | 9.9 | 15.2 | 11.7 | 16.3 | 14.6 | 14.3 | ||
| 2000 | 10.3 | 15.0 | 6.5 | 8.8 | 15.3 | 9.4 | 15.7 | 11.9 | 13.1 | 18.1 | 19.1 | 14.0 | 13.3 | 10.2 | 12.1 | 16.2 | 12.8 | ||
| 1999 | 17.6 | 18.6 | 10.3 | 10.7 | 9.7 | 5.6 | 13.9 | 22.9 | 13.0 | 9.8 | 17.0 | 9.3 | 12.8 | 10.3 | 13.7 | 13.2 | 12.4 | ||
| 1998 | 8.1 | 11.3 | 9.8 | 7.6 | 1.8 | 0.0 | 7.4 | 9.4 | 2.2 | 5.1 | 33.3 | 9.3 | 9.7 | 6.4 | 4.4 | 8.2 | 6.8 | ||
| 1997 | 11.5 | 10.3 | 3.6 | 7.9 | 5.1 | 1.9 | 11.8 | 10.5 | 17.5 | 10.1 | 20.0 | 4.2 | 8.8 | 5.3 | 6.6 | 13.9 | 8.2 | ||
| 1996 | 10.4 | 5.3 | 4.0 | 5.3 | 6.5 | 5.1 | 14.6 | 9.4 | 3.9 | 10.9 | 12.1 | 5.7 | 6.9 | 5.4 | 9.8 | 8.0 | 7.5 | ||
| 1995 | 14.0 | 14.0 | 4.9 | 5.5 | 10.9 | 6.9 | 10.6 | 7.9 | 6.1 | 9.7 | 9.1 | 6.4 | 11.7 | 6.9 | 8.7 | 8.4 | 8.8 | ||
| 1994 | 13.7 | 6.5 | 17.6 | 17.4 | 2.9 | 6.5 | 11.8 | 13.8 | 9.1 | 11.5 | 12.5 | 6.7 | 8.3 | 10.7 | 11.0 | 11.0 | 10.3 | ||
| 1993 | 12.2 | 11.5 | 6.5 | 10.7 | 10.6 | 4.3 | 20.4 | 12.5 | 28.4 | 23.3 | 10.4 | 11.6 | 11.7 | 9.4 | 12.6 | 20.6 | 13.8 | ||
| 1992 | 10.8 | 11.1 | 11.8 | 17.0 | 19.4 | 7.9 | 8.6 | 12.2 | 18.3 | 27.1 | 19.7 | 5.0 | 8.9 | 15.9 | 9.3 | 21.4 | 14.4 | ||
| 1991 | 10.2 | 14.9 | 10.5 | 6.8 | 14.4 | 9.5 | 16.1 | 14.0 | 14.3 | 18.6 | 13.1 | 18.0 | 13.3 | 10.5 | 12.8 | 15.3 | 12.7 | ||
| 1990 | 37.4 | 31.9 | 31.2 | 17.3 | 25.2 | 33.3 | 23.6 | 22.5 | 13.6 | 17.9 | 26.0 | 18.4 | 31.5 | 24.5 | 26.5 | 18.8 | 26.1 | ||
| 1989 | 49.0 | 29.3 | 40.6 | 38.8 | 33.8 | 38.7 | 42.0 | 35.6 | 35.0 | 37.4 | 42.1 | 34.5 | 37.2 | 38.0 | 38.7 | 38.0 | 38.0 | ||
| 1988 | 32.8 | 37.7 | 25.3 | 37.1 | 27.7 | 30.8 | 35.7 | 35.4 | 40.6 | 38.5 | 47.0 | 34.8 | 35.2 | 30.4 | 33.9 | 42.1 | 35.2 | ||
| 1987 | 54.5 | 26.7 | 30.0 | 29.7 | 33.7 | 27.0 | 27.7 | 27.9 | 28.7 | 39.5 | 33.2 | 41.7 | 41.3 | 31.4 | 27.6 | 34.1 | 32.1 | ||
| 1986 | 46.2 | 42.1 | 39.6 | 33.3 | 51.1 | 50.0 | 43.5 | 38.9 | 41.9 | 54.9 | 44.8 | 40.0 | 42.4 | 41.9 | 44.1 | 48.6 | 44.2 | ||
| 1985 | 30.0 | 33.3 | 30.8 | 30.2 | 33.3 | 21.7 | 12.5 | 23.5 | 27.3 | 15.8 | 30.0 | 17.9 | 27.3 | 31.3 | 21.2 | 22.5 | 27.5 | ||
| 1984 | 0.0 | 0.0 | 0.0 | 0.0 | 0.0 | 0.0 | 31.0 | 27.3 | 37.0 | 23.5 | 29.0 | 14.7 | 10.2 | 0.0 | 24.3 | 29.3 | 21.2 | ||
| 1983 | 0.0 | 0.0 | 0.0 | 15.4 | 44.4 | 15.4 | 0.0 | 0.0 | 0.0 | - | 0.0 | 0.0 | 0.0 | 22.2 | 6.7 | 0.0 | 8.0 | ||
| 1982 | - | 0.0 | - | 0.0 | 0.0 | 0.0 | - | 0.0 | - | 0.0 | - | 0.0 | 0.0 | 0.0 | 0.0 | 0.0 | 0.0 | ||
Breeding data
Breeding records by month
Number of breeding records by breeding code and month, 2017 and all years| Breeding code | Jul | Aug | Sep | Oct | Nov | Dec | Jan | Feb | Mar | Apr | May | Jun |
|---|---|---|---|---|---|---|---|---|---|---|---|---|
| 2017 | ||||||||||||
| Breeding (BLA code) | 0 | 0 | 0 | 1 | 1 | 0 | 0 | 0 | 0 | 0 | 0 | 0 |
| Carrying Food | 0 | 0 | 0 | 4 | 0 | 1 | 0 | 0 | 0 | 0 | 0 | 0 |
| Copulating | 0 | 0 | 0 | 0 | 0 | 0 | 0 | 0 | 0 | 0 | 0 | 0 |
| Display | 0 | 0 | 1 | 0 | 0 | 0 | 0 | 0 | 0 | 0 | 0 | 0 |
| Dependent young | 0 | 1 | 3 | 4 | 1 | 2 | 0 | 0 | 1 | 0 | 0 | 0 |
| Faecal sac | 0 | 0 | 0 | 0 | 0 | 0 | 0 | 0 | 0 | 0 | 0 | 0 |
| Inspecting hollow | 0 | 0 | 0 | 0 | 0 | 0 | 0 | 0 | 0 | 0 | 0 | 0 |
| Nest building | 0 | 1 | 3 | 1 | 0 | 1 | 0 | 0 | 0 | 0 | 0 | 0 |
| Nest with eggs | 0 | 0 | 0 | 0 | 0 | 0 | 0 | 0 | 0 | 0 | 0 | 0 |
| Nest with young | 0 | 0 | 0 | 0 | 1 | 0 | 0 | 0 | 0 | 0 | 0 | 0 |
| On/leaving nest | 0 | 0 | 0 | 1 | 0 | 0 | 0 | 0 | 0 | 0 | 0 | 0 |
| All years | ||||||||||||
| Breeding (BLA code) | 0 | 0 | 0 | 5 | 3 | 0 | 2 | 2 | 1 | 0 | 0 | 0 |
| Carrying Food | 0 | 0 | 4 | 30 | 4 | 5 | 2 | 0 | 0 | 0 | 0 | 0 |
| Copulating | 0 | 0 | 0 | 0 | 0 | 0 | 0 | 0 | 0 | 0 | 0 | 0 |
| Display | 0 | 0 | 1 | 0 | 0 | 0 | 0 | 0 | 0 | 0 | 0 | 0 |
| Dependent young | 0 | 1 | 6 | 48 | 30 | 19 | 14 | 8 | 1 | 1 | 0 | 0 |
| Faecal sac | 0 | 0 | 0 | 0 | 0 | 0 | 0 | 0 | 0 | 0 | 0 | 0 |
| Inspecting hollow | 0 | 0 | 0 | 0 | 0 | 0 | 0 | 0 | 0 | 0 | 0 | 0 |
| Nest building | 5 | 6 | 5 | 15 | 9 | 4 | 4 | 0 | 0 | 0 | 0 | 0 |
| Nest with eggs | 0 | 0 | 1 | 2 | 1 | 0 | 0 | 0 | 0 | 0 | 0 | 0 |
| Nest with young | 0 | 1 | 3 | 5 | 3 | 1 | 1 | 0 | 0 | 0 | 0 | 0 |
| On/leaving nest | 0 | 1 | 0 | 2 | 0 | 1 | 0 | 1 | 0 | 0 | 0 | 0 |
Breeding records by year
Average number of breeding records per period by breeding code| Period | Breeding (BLA code) | Carrying Food | Copulating | Display | Dependent young | Faecal sac | Inspecting hollow | Nest building | Nest with eggs | Nest with young | On/leaving nest |
|---|---|---|---|---|---|---|---|---|---|---|---|
| All years | |||||||||||
| All | 0.4 | 1.2 | 0.0 | 0.0 | 3.6 | 0.0 | 0.0 | 1.3 | 0.1 | 0.4 | 0.1 |
| Previous years | |||||||||||
| All previous years | 0.3 | 1.1 | 0.0 | 0.0 | 3.3 | 0.0 | 0.0 | 1.2 | 0.1 | 0.4 | 0.1 |
| Previous 30 years | 0.4 | 1.3 | 0.0 | 0.0 | 3.8 | 0.0 | 0.0 | 1.2 | 0.1 | 0.4 | 0.1 |
| Previous 20 years | 0.6 | 1.3 | 0.0 | 0.0 | 3.1 | 0.0 | 0.0 | 0.7 | 0.0 | 0.3 | 0.2 |
| 10 year groups | |||||||||||
| [2007,2017) | 0.9 | 2.3 | 0.0 | 0.0 | 4.7 | 0.0 | 0.0 | 0.8 | 0.0 | 0.4 | 0.3 |
| [1997,2007) | 0.2 | 0.3 | 0.0 | 0.0 | 1.5 | 0.0 | 0.0 | 0.5 | 0.0 | 0.2 | 0.1 |
| [1987,1997) | 0.0 | 1.4 | 0.0 | 0.0 | 5.1 | 0.0 | 0.0 | 2.2 | 0.4 | 0.7 | 0.0 |
| 5 year groups | |||||||||||
| [2012,2017) | 0.8 | 2.8 | 0.0 | 0.0 | 5.4 | 0.0 | 0.0 | 1.4 | 0.0 | 0.6 | 0.4 |
| [2007,2012) | 1.0 | 1.8 | 0.0 | 0.0 | 4.0 | 0.0 | 0.0 | 0.2 | 0.0 | 0.2 | 0.2 |
| [2002,2007) | 0.4 | 0.4 | 0.0 | 0.0 | 1.6 | 0.0 | 0.0 | 0.0 | 0.0 | 0.2 | 0.2 |
| [1997,2002) | 0.0 | 0.2 | 0.0 | 0.0 | 1.4 | 0.0 | 0.0 | 1.0 | 0.0 | 0.2 | 0.0 |
| [1992,1997) | 0.0 | 0.0 | 0.0 | 0.0 | 0.4 | 0.0 | 0.0 | 0.2 | 0.2 | 0.2 | 0.0 |
| [1987,1992) | 0.0 | 2.8 | 0.0 | 0.0 | 9.8 | 0.0 | 0.0 | 4.2 | 0.6 | 1.2 | 0.0 |
| Year | |||||||||||
| 2017 | 2.0 | 5.0 | 0.0 | 1.0 | 12.0 | 0.0 | 0.0 | 6.0 | 0.0 | 1.0 | 1.0 |
| 2016 | 0.0 | 2.0 | 0.0 | 0.0 | 6.0 | 0.0 | 0.0 | 2.0 | 0.0 | 1.0 | 0.0 |
| 2015 | 0.0 | 5.0 | 0.0 | 0.0 | 5.0 | 0.0 | 0.0 | 0.0 | 0.0 | 1.0 | 1.0 |
| 2014 | 1.0 | 4.0 | 0.0 | 0.0 | 3.0 | 0.0 | 0.0 | 1.0 | 0.0 | 1.0 | 1.0 |
| 2013 | 0.0 | 0.0 | 0.0 | 0.0 | 8.0 | 0.0 | 0.0 | 0.0 | 0.0 | 0.0 | 0.0 |
| 2012 | 3.0 | 3.0 | 0.0 | 0.0 | 5.0 | 0.0 | 0.0 | 4.0 | 0.0 | 0.0 | 0.0 |
| 2011 | 0.0 | 0.0 | 0.0 | 0.0 | 6.0 | 0.0 | 0.0 | 0.0 | 0.0 | 1.0 | 1.0 |
| 2010 | 1.0 | 0.0 | 0.0 | 0.0 | 6.0 | 0.0 | 0.0 | 0.0 | 0.0 | 0.0 | 0.0 |
| 2009 | 1.0 | 1.0 | 0.0 | 0.0 | 2.0 | 0.0 | 0.0 | 1.0 | 0.0 | 0.0 | 0.0 |
| 2008 | 0.0 | 6.0 | 0.0 | 0.0 | 4.0 | 0.0 | 0.0 | 0.0 | 0.0 | 0.0 | 0.0 |
| 2007 | 3.0 | 2.0 | 0.0 | 0.0 | 2.0 | 0.0 | 0.0 | 0.0 | 0.0 | 0.0 | 0.0 |
| 2006 | 1.0 | 1.0 | 0.0 | 0.0 | 3.0 | 0.0 | 0.0 | 0.0 | 0.0 | 1.0 | 0.0 |
| 2005 | 1.0 | 0.0 | 0.0 | 0.0 | 2.0 | 0.0 | 0.0 | 0.0 | 0.0 | 0.0 | 0.0 |
| 2004 | 0.0 | 0.0 | 0.0 | 0.0 | 0.0 | 0.0 | 0.0 | 0.0 | 0.0 | 0.0 | 1.0 |
| 2003 | 0.0 | 1.0 | 0.0 | 0.0 | 0.0 | 0.0 | 0.0 | 0.0 | 0.0 | 0.0 | 0.0 |
| 2002 | 0.0 | 0.0 | 0.0 | 0.0 | 3.0 | 0.0 | 0.0 | 0.0 | 0.0 | 0.0 | 0.0 |
| 2001 | 0.0 | 0.0 | 0.0 | 0.0 | 0.0 | 0.0 | 0.0 | 2.0 | 0.0 | 0.0 | 0.0 |
| 2000 | 0.0 | 1.0 | 0.0 | 0.0 | 6.0 | 0.0 | 0.0 | 1.0 | 0.0 | 0.0 | 0.0 |
| 1999 | 0.0 | 0.0 | 0.0 | 0.0 | 1.0 | 0.0 | 0.0 | 0.0 | 0.0 | 0.0 | 0.0 |
| 1998 | 0.0 | 0.0 | 0.0 | 0.0 | 0.0 | 0.0 | 0.0 | 0.0 | 0.0 | 1.0 | 0.0 |
| 1997 | 0.0 | 0.0 | 0.0 | 0.0 | 0.0 | 0.0 | 0.0 | 2.0 | 0.0 | 0.0 | 0.0 |
| 1996 | 0.0 | 0.0 | 0.0 | 0.0 | 1.0 | 0.0 | 0.0 | 1.0 | 0.0 | 0.0 | 0.0 |
| 1995 | 0.0 | 0.0 | 0.0 | 0.0 | 1.0 | 0.0 | 0.0 | 0.0 | 0.0 | 0.0 | 0.0 |
| 1994 | 0.0 | 0.0 | 0.0 | 0.0 | 0.0 | 0.0 | 0.0 | 0.0 | 0.0 | 1.0 | 0.0 |
| 1993 | 0.0 | 0.0 | 0.0 | 0.0 | 0.0 | 0.0 | 0.0 | 0.0 | 0.0 | 0.0 | 0.0 |
| 1992 | 0.0 | 0.0 | 0.0 | 0.0 | 0.0 | 0.0 | 0.0 | 0.0 | 1.0 | 0.0 | 0.0 |
| 1991 | 0.0 | 0.0 | 0.0 | 0.0 | 1.0 | 0.0 | 0.0 | 1.0 | 0.0 | 1.0 | 0.0 |
| 1990 | 0.0 | 1.0 | 0.0 | 0.0 | 6.0 | 0.0 | 0.0 | 0.0 | 0.0 | 1.0 | 0.0 |
| 1989 | 0.0 | 7.0 | 0.0 | 0.0 | 17.0 | 0.0 | 0.0 | 6.0 | 0.0 | 2.0 | 0.0 |
| 1988 | 0.0 | 2.0 | 0.0 | 0.0 | 10.0 | 0.0 | 0.0 | 4.0 | 0.0 | 2.0 | 0.0 |
| 1987 | 0.0 | 4.0 | 0.0 | 0.0 | 15.0 | 0.0 | 0.0 | 10.0 | 3.0 | 0.0 | 0.0 |
| 1986 | 0.0 | 0.0 | 0.0 | 0.0 | 0.0 | 0.0 | 0.0 | 7.0 | 0.0 | 0.0 | 0.0 |
| 1985 | 0.0 | 0.0 | 0.0 | 0.0 | 3.0 | 0.0 | 0.0 | 0.0 | 0.0 | 0.0 | 0.0 |
| 1984 | 0.0 | 0.0 | 0.0 | 0.0 | 0.0 | 0.0 | 0.0 | 0.0 | 0.0 | 0.0 | 0.0 |
| 1983 | 0.0 | 0.0 | 0.0 | 0.0 | 0.0 | 0.0 | 0.0 | 0.0 | 0.0 | 0.0 | 0.0 |
| 1982 | 0.0 | 0.0 | 0.0 | 0.0 | 0.0 | 0.0 | 0.0 | 0.0 | 0.0 | 0.0 | 0.0 |
Distribution map
Distribution - 2017
This map shows the observed distribution of the White-browed Scrubwren for 2017.
The red circles are the grid cells where White-browed Scrubwren have been reported.
The transparency of the red circles indicate how many surveys sheets were submitted for that grid cell; the darker the red the more reliable the data. Of the 315 grid cells with reports, 83 had only one sheet; an example is grid number A11.
The size of the circle represents the reporting rate. The maximum reporting rate for White-browed Scrubwren was 100.0% (eg grid number A11) and the minimum was 0.3% (eg grid number L10). 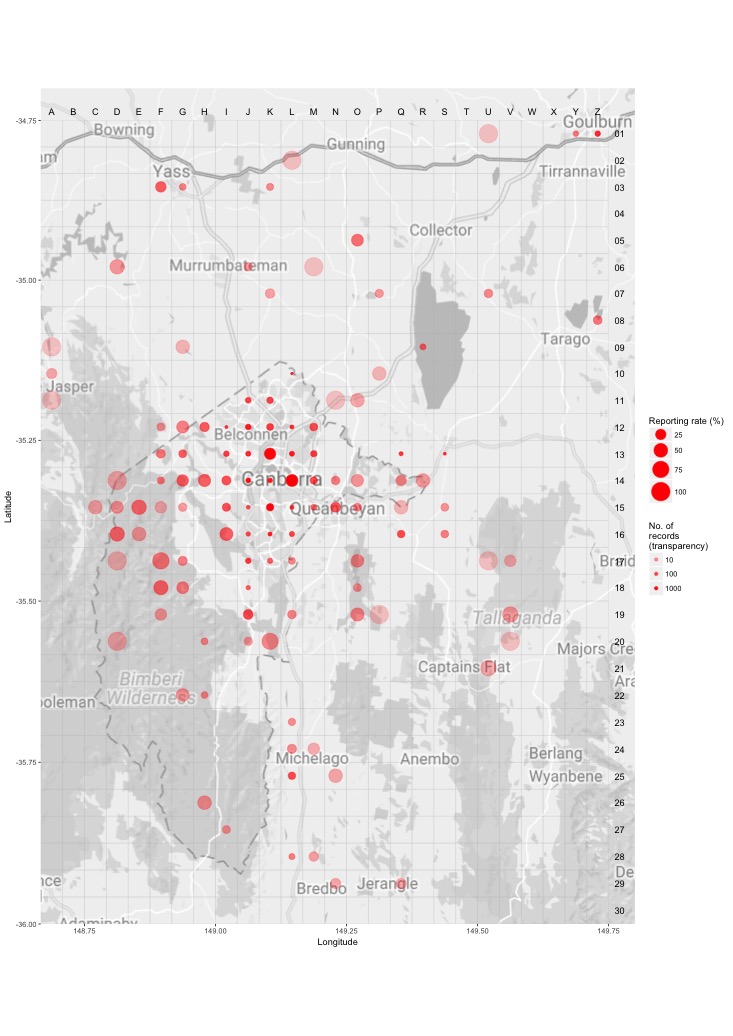
Distribution - all years
This map shows the observed distribution of the White-browed Scrubwren for all years.
The red circles are the grid cells where White-browed Scrubwren have been reported.
The transparency of the red circles indicate how many surveys sheets were submitted for that grid cell; the darker the red the more reliable the data. Of the 703 grid cells with reports, 55 had only one sheet; an example is grid number A5.
The size of the circle represents the reporting rate. The maximum reporting rate for White-browed Scrubwren was 100.0% (eg grid number A15) and the minimum was 0.1% (eg grid number S13). 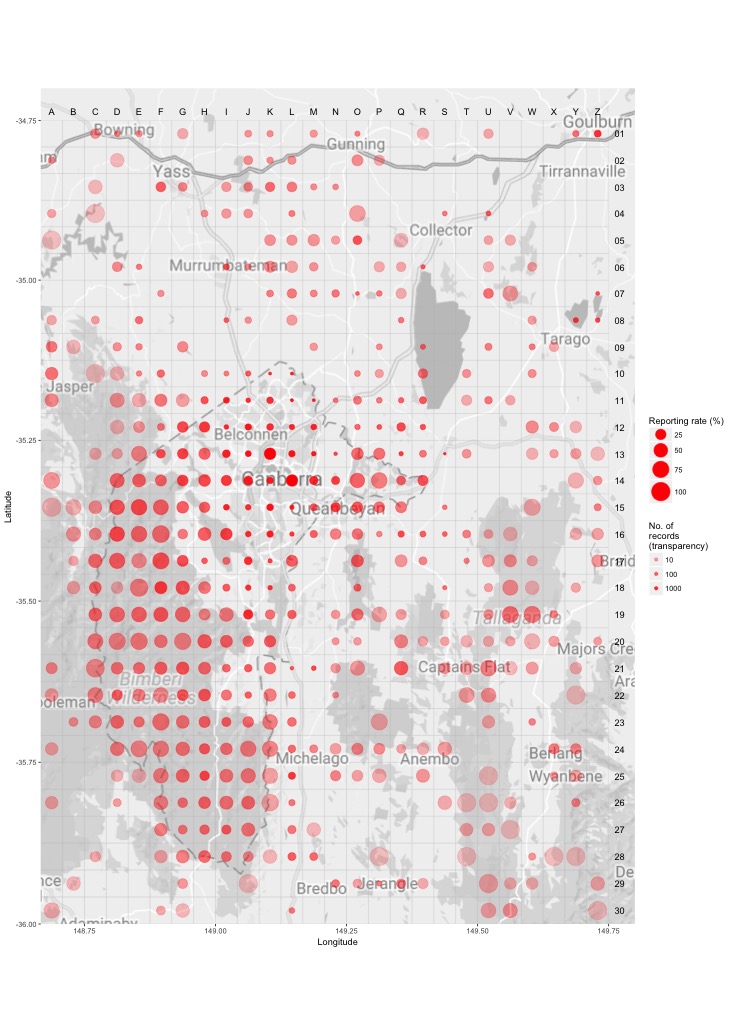
Breeding map
Breeding - 2017
This map shows the breeding distribution of the White-browed Scrubwren for 2017.
The red circles are the grid cells where breeding activity for White-browed Scrubwren have been reported.
The size of the circle represents the number of reports. 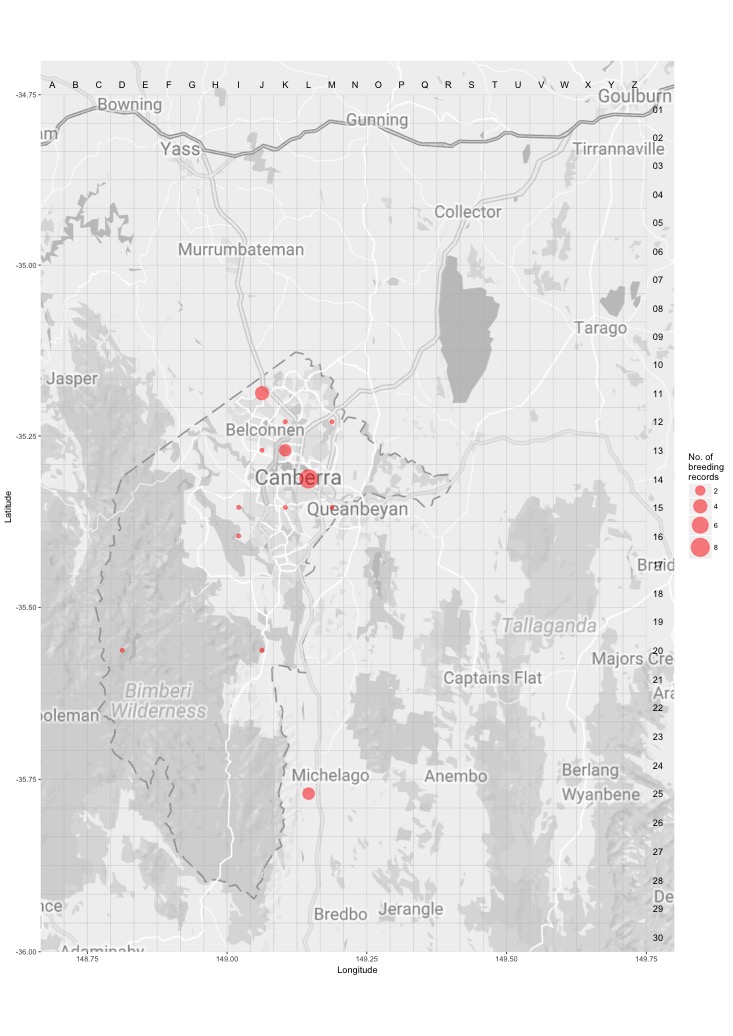
Breeding - all years
This map shows the breeding distribution of the White-browed Scrubwren for all years.
The red circles are the grid cells where breeding activity for White-browed Scrubwren have been reported.
The size of the circle represents the number of reports. 